Solutions
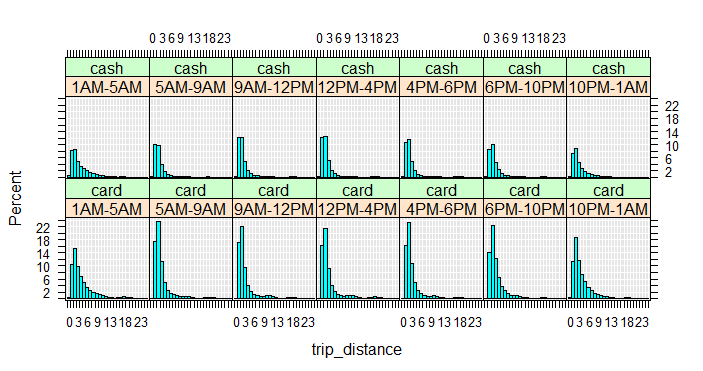
(1) We simply add | pickup_hour + payment_type to the formula in rxHistogram
rxHistogram( ~ trip_distance | pickup_hour + payment_type, nyc_xdf,
            startVal = 0, endVal = 25, histType = "Percent", numBreaks = 20)
(2) We have a choice here between two options:
- use
rxDataStepand thetransformsto perform this transformation and write it out to the data, then userxHistogramto plot it - use the
transformsargument directly insiderxHistogramto perform the transformation on the fly and for the sake of plotting it, without writing it to the data
Creating too many new columns in the data based on existing columns can make the data unnecessarily large, which will cost us in terms of I/O. This is especially unnecessary when the new columns we create don't serve us much beyond looking at plot or a particular summary. In such cases, it's usually faster to chose the second option and create the column on the fly.
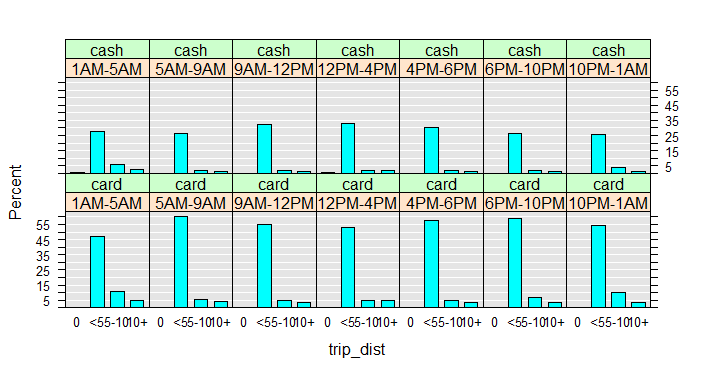
rxHistogram( ~ trip_dist | pickup_hour + payment_type, nyc_xdf, histType = "Percent",
             transforms = list(trip_dist = cut(trip_distance,
                                               breaks = c(-Inf, 0, 5, 10, Inf),
                                               labels = c("0", "<5", "5-10", "10+"))))