Solutions
(1) We can sort the vector in reverse order, throw out the top n entries and then compute the average.
mean.minus.top.n <- function(x, n) {
  mean(-sort(-x)[-(1:n)], na.rm = TRUE)
}
mean.minus.top.n(c(1, 5, 3, 99), 1)
[1] 3
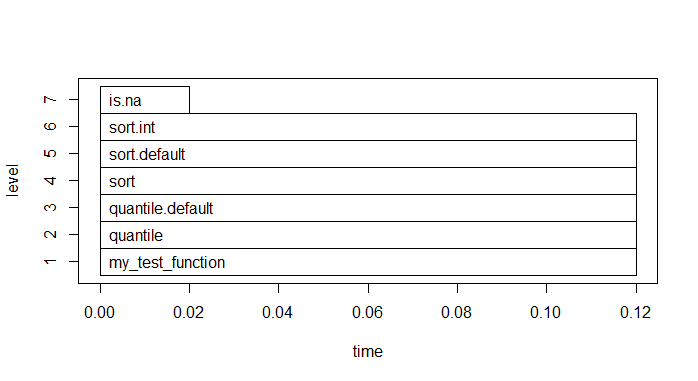
(2) Based on the plot we can see that the almost all of the runtime of my_test_function is spent on sorting the vector. Sorting is a computationally intensive process and many algorithms have been devised to sort data for that reason.
(3) We can look at the mean column to compare the average runtime of running first 10 times (recall that we set times = 10) to the average runtime for scond. We can see that scond is about twice as long.
Unit: milliseconds
              expr   min    lq  mean median    uq   max neval
 first(random.vec)  62.7  68.9  78.2   75.8  89.8  97.4    10
 scond(random.vec) 119.8 130.3 139.3  140.7 146.9 157.6    10